
Great Atlantic: North America's Only FS-Stage Salt Project
Atlas Salt’s Great Atlantic deposit, strategically located next to a deep water port, is expected to become North America’s first new salt mine in nearly three decades. It will be a unique and long-life electric-based operation accessed through inclined ramps vs. vertical shafts based on an independent Updated Feasibility Study (“UFS”) carried out by SLR Consulting (Canada) Ltd.”), with contributions from specialized engineering and technical partners including Shaft and Tunnel Consulting Services Ltd., Terrane Geoscience Inc., Sandvik Mining and Rock Solutions (“Sandvik”), and Tamarack Resources.
The Company detailed the results of the UFS in a news release on September 30, 2025, and has now filed an NI 43-101 Technical Report on SEDAR+. The UFS builds on the 2023 Feasibility Study (“2023 FS”), incorporating optimizations in mine design, throughput, port logistics, and capital efficiency.
The results confirm Great Atlantic as a large scale, high-purity, low-cost underground salt project strategically positioned to serve the North American market.

Feasibility Study
(all figures are in Canadian dollars and include annual escalation, unless otherwise noted)
- Post-tax NPV8: $920 million, Post-tax IRR: 21.3%, Payback: 4.2 Years
- Pre-tax NPV8: $1.68 billion, Pre-tax IRR: 27.1%
- Pre-tax NPV5: $2.75 billion, Post-tax NPV5: $1.57 billion
- Initial Capital Cost: $589 million
- Life of Mine (“LOM”) Sustaining Capital: $609 million
- Average Annual LOM Operating Cashflow (EBITDA1) in Operations: $325 million per annum (“pa”)
- Average Annual LOM Post-Tax Free Cashflow in Operation: $188 million pa
- Total Undiscounted Post-Tax Cashflow (including Initial Capital Cost): $3.93 billion
- Average Annual Steady State Production LOM: 4.0 million tonnes of high-purity road salt
- Mine Life: 24 years based on Proven and Probable Reserves
- Average Operating Cost: $28.17 per tonne free on board (“FOB”) mine site port
- Production Rate: 4.0 million tonnes per annum (“Mtpa”)
- Port Capacity: Designed for scalable throughput up to 4.0 Mtpa
[1] EBITDA is a non International Financial Reporting Standards (“IFRS”) financial measure and represents earnings before interest, income taxes, depreciation and amortization. It is not defined under IFRS and may not be comparable to similar measures presented by other companies. Management believes that this measure provides useful supplemental information to investors in evaluating the Project’s operating performance and its ability to generate cash flows. EBITDA is closely approximated in this model by Operating Cashflow, defined as Net Revenues less cash operating costs.
Atlas Salt has summarized the quantitative differences between the 2023 FS and the UFS. Unless otherwise noted, figures are presented as LOM totals or averages.
| Metric | 2023 FS | 2025 UFS | Variance (Abs.) | Variance (%) |
Production Rate (Mtpa) | 2.5 | 4.0 | +1.5 | +60% |
Mine Life (years) | 34 | 24 | (10) | (29.5%) |
Tonnes Produced / Sold (LOM, Mt) | 83.7 | 90.3 | +6.6 | +8% |
Salt Price (FOB port, $/t, LOM Average) | $124.86 | $118.49 | ($6.37) | (5%1 |
Operating Cost ($/t) | $27.49 | $22.00 | ($5.49) | (20%)2 |
Pre-tax NPV8 ($M) | $1,017 | $1,683 | +$666 | +65% |
After-tax NPV8 ($M) | $553M | $920M | +367M | +66% |
Average LOM Operating Cashflow in Operation (~EBITDA1) $M/a | $211M | $315M | +$104M | +49% |
Average LOM Post-Tax Cashflow in Operation $M/a | $121M | $188M | +$67M | +55% |
Post-tax IRR (%) | 18.5% | 21.3% | +2.8% | +15% |
Initial Capital ($M) | $480M | $589M | +$109M | +23% |
Sustaining Capital (LOM, $M) | $600M | $609M | +$9M | +2% |
Payback Period (years) | 4.8 | 4.2 | (0.6) | (12%) |
| Post-Tax NPV8 / Initial CAPEX Ratio | 1.15 | 1.56 | +0.41 | +36% |
[1] From shorter overall mine life
[2] From shorter overall mine life and economies of scale
A number of strategic and technical improvements have been made in the UFS, including:
- Optimized Production Plan – Incorporates updated geotechnical, ventilation, and infrastructure studies to support efficient construction and long-term operations.
- Equipment Integration – Deployment of Sandvik continuous mining equipment to improve productivity and reduce unit operating costs.
- Port & Logistics Improvements – Upgraded stockpile and shiploading configurations to support high-capacity, efficient loading.
- Economic Resilience – Financial model reflects updated costs, pricing assumptions (including inflationary trends), and robust project economics.
- Regulatory Alignment – Incorporates all post-Environmental Assessment release conditions, ensuring compliance.
These changes collectively demonstrate improved project resilience and stronger cash flow generation and returns potential, while further de-risking execution.
UFS Technical Summary
Overview
The UFS considers developing Great Atlantic into an underground operating mine capable of producing 4.0 Mtpa of rock salt. . Construction of the mine would occur over three years, with access to the deposit via twin declines. Extraction of rock salt would occur using the room and pillar method, with continuous mining equipment. Salt would be processed to a specific size and grade using a crushing and screening plant located within the underground mine, and then brought to surface via conveyor belts. An overland conveyor would transport the rock salt from the mine area to the existing Turf Point port for loading onto ships destined for Canadian and American markets.
Geology and Mineral Resources
The Great Atlantic deposit is a flat-lying, laterally extensive, high-purity halite formation with minimal insoluble content. No changes were made to the Mineral Resource estimate completed in the 2023 FS. Table 1 provides a summary of the Mineral Resource estimate by SLR, with an effective date of September 30, 2025.
Table 2: Mineral Resource Estimate – September 30, 2025
Category | Horizon | Tonnes (Mt) | Grade (% NaCl) | Contained NaCl (Mt) |
Indicated | 1-Salt | – | – | – |
2-Salt | 160 | 95.9 | 154 | |
3-Salt | 223 | 96.0 | 214 | |
Total | 383 | 96.0 | 368 |
Inferred | 1-Salt | 195 | 95.3 | 186 |
2-Salt | 288 | 95.3 | 274 | |
3-Salt | 385 | 95.0 | 366 | |
Total | 868 | 95.2 | 827 |
Notes:
- CIM (2014) definitions were followed for Mineral Resources.
- Mineral Resources are estimated without a reporting cut-off grade. Reasonable Prospects for Eventual Economic Extraction were instead demonstrated by reporting within Mineable “Stope” Optimised (MSO) shapes, with a minimum height of 5 m, minimum width of 20 m, length of 40 m, and minimum grade of 90% NaCl, with a 5 m minimum pillar width between shapes.
- Bulk density is 2.16 t/m3.
- Mineral Resources that are not Mineral Reserves do not have demonstrated economic viability.
- Mineral Resources are inclusive of Mineral Reserves.
- Salt prices are not directly incorporated into the Mineral Resource MSO minimum target grades, however, the mean Mineral Resource grades exceed the 95.0% NaCl (± 0.5%) specification outlined in ASTM Designation D632-12 (2012).
- Numbers may not add due to rounding.
The Updated Feasibility Study uses the same Mineral Resource estimate completed in the 2023 FS. There have been no changes to the Mineral Resource estimate between the 2023 FS and the UFS (2025). The Mineral Resource estimate has a new effective date of September 30, 2025.
General Description of Operations and Process Plan
The capital and operating cost estimates in the UFS have been prepared in accordance with the guidelines of the Association for the Advancement of Cost Engineering (AACE) for a Class 3 estimate. This level of estimate is typically based on feasibility-level engineering, vendor quotations, and discipline-level design sufficient to support a financing decision. The accuracy range for initial capital costs is considered to be within approximately -10% to +30%, while the accuracy for operating costs is estimated to be within approximately -10% to +20%. Costs are based on Q3 2025 data.
The estimates incorporate contingency allowances to reflect the current design, anticipated execution risks, and prevailing market conditions for labour, materials, and equipment. They are also benchmarked against comparable projects and historical data for underground salt operations.
Table 3 – Summary of UFS Economic Results and Assumptions3
UFS Economic Model Results and Assumptions | Value |
2025 Salt Price Assumed ($/t) | $81.67 / t FOB port. |
Pre-Tax NPV₈ & IRR ($/%) | $1.68 billion / 27.1 % |
Post-Tax NPV₈ & IRR ($/%) | $920 million / 21.3% |
Undiscounted Post-Tax Cashflow (LOM) ($) | $3.93 billion |
Average LOM Operating Cashflow (EBITDA1) ($/a) | $325 million |
Average LOM Post-Tax Cashflow ($/a) | $188 million |
Post-Tax Payback Period (from first production) | 4.2 years |
Initial Capital ($) | $589 million |
LOM Sustaining Capital ($) | $609 million |
Average LOM Operating Cost (FOB port) ($/t) | $28.17 / t |
Average Annual Steady-State Salt Production (Mtpa) | 4.0 Mt |
Life of Mine (LOM) (Years) | 24 years |
Total Tonnes Produced / Sold (LOM) (Mt) | 90.3 Mt |
Estimated Reserve Grade (% NaCl) | 95.9 % NaCl |
[3] Unless otherwise noted, values are presented in Canadian dollars and expressed in real terms as of 2025. Certain figures (e.g., NPV, IRR, payback) are derived outputs of the discounted cash flow model rather than direct 2025-dollar inputs. The salt price assumption is stated in 2025 Canadian dollars FOB mine site port facility. Salt pricing was determined by an independent third-party marketing study. The port facility is assumed to be operated by a third-party contractor, with associated costs incorporated into the economic analysis.
Mining Method and Design
- Method: Room-and-pillar underground mining using continuous miners.
- Pillar Configuration: Designed for long-term stability, with pillar dimensions and sequencing optimized for maximum extraction while ensuring ground control.
- Development: Access via surface portal and conveyor decline system; mine layout configured for scalable expansion.
- Production Rate: 4.0 Mtpa steady-state by Year 4, with ramp-up commencing in Year 1.
- Daily Production Rate: Approximately 11,500 tonnes per day at steady-state capacity.
Mining and Mineral Reserves
The Updated Feasibility Study is supported by the Mineral Reserve estimate summarized in Table 4. These Probable Reserves have been prepared in accordance with NI 43-101 and reflect appropriate modifying factors for mining, recovery, and economics at a feasibility study level. The Mineral Reserves have an effective date of September 30, 2025.
Table 4 – Summary of Mineral Reserves
| Category | Horizon | Tonnes (Mt) | Grade (% NaCl) | Contained NaCl (Mt) |
| Probable | 2-Salt | 39.3 | 95.9 | 37.6 |
| 3-Salt | 55.8 | 95.9 | 53.5 | |
| Total | All | 95.0 | 95.9 | 91.1 |
Notes:
- CIM (2014) definitions were followed for Mineral Reserves.
- Salt prices are not directly incorporated into the Mineral Reserve designs, however the mean Mineral Reserve grades exceed the 95% NaCl (±0.5%) specification outlined in ASTM Designation D632-12(2012).
- A minimum mining height of 5.0 m and width of 17.0 m were used for production rooms.
- Sterilization zone 8.0 m below the top of salt and 5.0 m above the bottom of salt have been applied.
- A mining extraction factor of 100% was applied to all excavations.
- Bulk density is 2.16 t/m3.
- Planned process recovery is 95%.
- Numbers may not add due to rounding.
Table 5 compares the Probable Reserves from the 2023 FS with the current UFS.
Table 5 – Mineral Reserve Comparison
| Category | Horizon | 2023 FS Reserves | 2025 UFS Reserves | Variance (Abs.) | Variance (%) |
Probable (Mt) | 2-Salt | 37.7 Mt @ 95.9% NaCl | 39.3 Mt @ 95.9% NaCl | 1.5 Mt | +4.1% |
| 3-Salt | 50.3 Mt @ 96.0% NaCl | 55.8 Mt @ 95.9% NaCl | 5.4 Mt | +10.8% | |
| Total | 88.1 Mt @ 96.0% NaCl | 95.0 Mt @ 95.9% NaCl | 7.0 Mt | +7.9% |
The changes are principally related to different pillar and room dimensions, and minor variances in level spacing.
Processing and Product Handling
Salt is crushed and screened underground to market specifications, conveyed to surface, and transported to the port via covered conveyor. No chemical processing or water usage in processing is required, other than the application of an anti-caking agent immediately prior to shipment offsite.
Project Location and Infrastructure
The Great Atlantic Salt Project is located near St. George’s, Newfoundland, approximately 3 km from the Trans-Canada Highway and adjacent to deepwater port facilities on the west coast of Newfoundland. The location provides direct access to tidewater shipping routes serving Eastern Canada, the U.S. Northeast and Western Europe.
Infrastructure required for the Project includes:
- Port: Dedicated port storage and shiploading system designed for 4.0 Mtpa throughput at full operations.
- Shiploading: Continuous conveyor-fed shiploader with optimized cycle times to minimize vessel demurrage.
- Storage: Surface stockpile capacity of approximately 72 kt, equivalent to 6.5 days of average production.
- Utilities: Connection to provincial power grid with dedicated substation;
- Power: The Project is expected to require approximately 10 megawatts (MW) of connected load at steady-state operations, sourced from the provincial grid via a dedicated substation.
- Accommodation: No camp facilities are included in the design, with the Project benefiting from proximity to established communities and existing regional infrastructure.
Marketing and Logistics
As part of the UFS, Atlas and SLR commissioned multiple independent assessments of marketing and logistics. These independent assessments have formed the basis of the assumptions used in the FS.
Rock salt produced from Great Atlantic will initially target the regional deicing markets in eastern Canada and the US East Coast. It is estimated that this market requires between 11.0 Mtpa and 16.0 Mtpa of rock salt in any given year, sourced from domestic and international suppliers, with the demand highly correlated to weather conditions. The primary customers of rock salt are government entities which use a tender system for the annual supply of deicing salt. Secondary customers include commercial deicing operators.
Government entities include municipalities, Departments of Transportation (DoT), counties, and other provincial or state entities, while commercial operators may vary from distribution companies for retail purchase, or contractors who purchase rock salt for de-icing commercial and private properties.
Cash Flow Model Basis
SLR has prepared a cash flow model that is based on a 24-year mine plan with a production rate of 4.0 Mtpa. It is noted that the Mineral Resource base will allow for a much longer mine life. The mine schedule includes a four year ramp up period, with year one production of 1.7 Mtpa, year two production of 2.8 Mtpa, year three production of 3.9 Mtpa, and year four reaching steady-state production of 4.0 Mtpa.
The cash flow model comprises estimates of capital costs, operating costs, an assessment of revenue, and estimate of project economic metrics such as net present value, internal rate of return, and payback period. Economic metrics were assessed both on a pre- and post-tax basis.
SLR has assumed that pre-construction activities commence in 2026, construction of the mine would commence in 2027, with salt production commencing in 2030. To bring salt prices to a 2030 base date, SLR has applied a 4.0% annual increase to the price of salt, which is consistent with other publicly available technical reports on existing salt operations in North America. Beyond 2030, SLR has applied a 2.0% annual increase to the price of salt. In terms of costs, SLR has applied 2.0% annual inflation to capital and operating costs.
Capital Costs
The initial capital cost for the Great Atlantic Salt Project is estimated at approximately $589 million, covering underground mine development, mining equipment, surface infrastructure, port facilities, utilities, and indirect costs, with contingency applied to reflect feasibility-level design maturity. Sustaining capital over the LOM is estimated at $609 million total, averaging approximately $26.5 million per year, and primarily relates to underground development, conveyor extensions, and equipment replacement.
Table 6 – Initial and Sustaining Capital Summary Table
Area | Initial Capital ($M) | LOM Sustaining ($M) | Total ($M) |
Underground Mine Development & Equipment | $203M | $545M | $748M |
Processing Plant | $42M | $31M | $73M |
Surface Infrastructure & Port Facilities | $132M | $33M | $165M |
Owner’s Costs & Indirects | $134M | $134M | |
Contingency (approx. 15.1%) | $77M | $77M | |
Total Capital | $589M | $609M | $1,198M |
Note: Direct Sustaining CAPEX figures are inclusive of Indirects and Contingency
Operating Costs
The operating cost estimates were developed from first principles using a combination of vendor quotations, budgetary pricing from equipment suppliers, labour and power cost assumptions specific to Newfoundland, and benchmarking against comparable underground salt operations. Mining, processing, and port handling costs reflect the planned use of continuous miners, conveyor haulage, and high-capacity shiploading infrastructure. General and administrative (G&A) costs are based on staffing requirements and site services, while closure and bonding provisions reflect anticipated regulatory obligations. Costs are expressed on a LOM average basis and are considered accurate to within -10% to +20%, consistent with a feasibility-level estimate.
Table 7 – Operating Cost Estimates
Item | Total Operating Cost ($M) | Unit Operating Cost ($/t) |
Mining | $1,354M | $15.00 |
Processing & Handling | $297M | $3.29 |
G&A | $335M | $3.71 |
Port Operations | $557M | $6.17 |
Total | $2,543M | $28.17 |
Notes: Numbers may not add due to rounding.
Sensitivity Analysis
The Project economics are most sensitive to salt price, capital costs, and operating costs assumptions. Sensitivity testing indicates that the Updated Feasibility Study maintains robust economics across a wide range of assumptions.
Table 8 – Economic and Sensitivity Analysis
Sensitivity Variance | Sensitivity Value | Post-Tax NPV₈ | Post-Tax IRR | |
(%) | (By Row) | ($M) | (%) | |
2025 Salt Price Sensitivity | (10%) | $73.50 | $474M | 16.9% |
0% | $81.67 | $920M | 21.3% | |
10% | $89.84 | $1,483M | 25.0% | |
CAPEX Sensitivity ($) | (10%) | $530M | $963M | 22.9% |
0% | $589M | $920M | 21.3% | |
10% | $649M | $891M | 20.2% | |
OPEX Sensitivity ($/t) | (10%) | $19.80/t | $973M | 22.0% |
0% | $22.00/t | $920M | 21.3% | |
10% | $24.20/t | $881M | 20.9% |
Even under downside scenarios, the Project demonstrates positive economics and resilience, highlighting its strategic competitive positioning in the North American road salt market.
Economic Outcomes
The resulting economics of the Project including net present value (NPV) and internal rate of return (IRR) are presented in Table 9. Results from the 2023 FS are shown for comparison purposes.
Table 9 – Economic Outcomes Comparison with 2023 FS
| Metric | 2023 FS | 2025 UFS | Variance (Abs.) | Variance (%) |
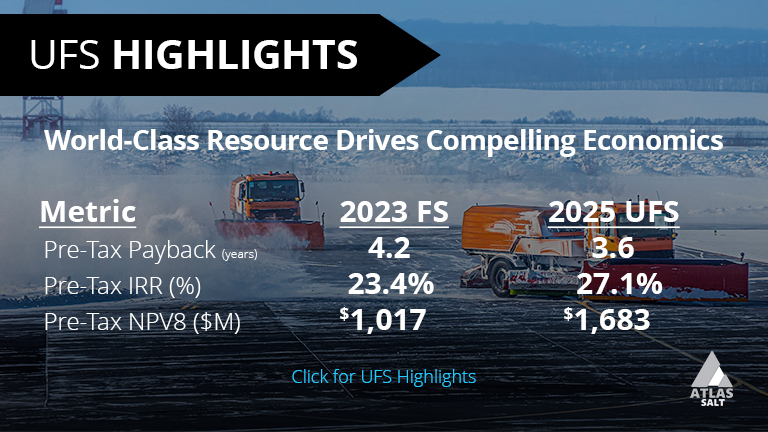
Pre-Tax Payback Period (years) | 4.2 | 3.6 | (0.6) | (14%) |
Pre-Tax IRR (%) | 23.4% | 27.1% | +3.7% | +16% |
Pre-Tax NPV5 ($M) | $1,900 | $2,759 | +$859 | +45% |
Pre-Tax NPV8 ($M) | $1,017 | $1,683 | +$666 | +65% |
Pre-Tax NPV10 ($M) | $681 | $1,220 | +$539 | +79% |
Post-Tax Payback Period (years) | 4.8 | 4.2 | (0.6) | (12%) |
Post-Tax IRR (%) | 18.5% | 21.3% | +2.8% | +15% |
Post-Tax NPV5 ($M) | $1,089 | $1,574 | +$485 | +45% |
Post-Tax NPV8 ($M) | $553 | $920 | +$367 | +66% |
Post-Tax NPV10 ($M) | $349 | $609 | +$260 | +74% |